In your job quest, you may find it useful to become more knowledgeable on the nonprofit sector. The statistics provided on this page are designed to broaden your understanding of the sector but in no way offer a complete picture of the intricacies within the sector.
According to the Foundation Center, in 2009 there were a reported 76,545 foundations in the United States. In 2010, foundations gave away approximately $45.7 billion. The source breakdown is as follows:
- 71% came from independent foundations
- 9% came from community foundations
- 10% came from corporate foundations
- 10% came from operating foundations
Below is a sampling of data that may help you to form a more well-rounded understanding of the makeup of foundation staff and the salary and benefits offerings available at various foundations.
Foundation Staff
- Only 27.4% of foundations report having a staff
- Average Number of Staff at Operating Foundations: 31.7
- Average Number of Staff at Corporate Foundations: 3.2
- Average Staff at Independent Foundations: 5.1
- Average Staff at Community Foundations: 8.2
Representative Human Resources Data: Benefits, tenure, and promotion
- Close to one-quarter of CEOs/CGOs were promoted from within
- Almost 40% of CEOs/CGOs have held that job for at least 10 years
- Half of the respondents reported no turnover at their foundations during 2009
- Program Officers account for 11% of reported staff
- Most foundations provided medical benefits in 2010
- Nearly all foundations offered voluntary benefits to full-time staff
Gender:
- Women represented 75% of all foundation staff in 2010
- Women represented 56% of Chief Executive Officers (CEOs)/Chief Giving Officers (CGOs)
- At larger foundations, women represent 34% of CEOs/CGOs
Age:
- 10% of foundation staff is under 30
- 2 out of 5 foundation staff is 50 or older
Race/Ethnicity:
- Racial/ethnic minorities represented 25% of foundation staff in 2010
- Less than 9% of CEOs/CGOs were ethnic minorities
Disabilities:
Less than 5% of foundations reported having at least one person with disabilities on staff
The current numbers don’t tell the whole story—the philanthropic sector is working hard to increase its diversity.
Click here for more information on Philanthropy New York’s Special Committee to Increase Diversity in Philanthropy and D5, a national coalition to grow philanthropy’s diversity, equity, and inclusion. This is by no means an all-inclusive list of efforts to increase diversity in philanthropy, but it will offer you a more complete understanding of efforts within the sector to address this issue.
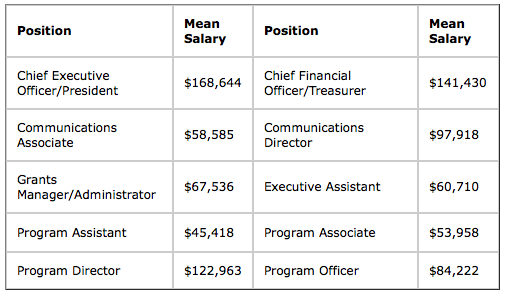
Sampling of the Mean Salary for All Foundation Types, All Regions
Sources:
Foundation Center: http://foundationcenter.org/findfunders/statistics/
National Center for Charitable Statistics (NCCS): http://nccs.urban.org/statistics/quickfacts.cfm
Council on Foundations: 2010 Grantmakers Salary and Benefits Report